New EMA tools on our platform

Technical indicators now available!
We have great news for all of our traders – you can now add EMA tools on our charts to help you make greater profits trading. Let’s have a little look at what EMA-s are and how you can use these indicators and what are a few popular strategies you can implement.
What is EMA ?
Exponential Moving Average
Definition of Exponential Moving Average:
A type of moving average that is similar to a simple moving average, except that more weight is given to the latest data. The exponential moving average is also known as “exponentially weighted moving average.”
Read more: Exponential Moving Average (EMA) Definition | Investopedia http://www.investopedia.com/terms/e/ema.asp#ixzz3kkeTVfwu
EMA has grown from SMA – Simple Moving Average, it’s an update if you like which helps you determine price action better than SMA. The SMA is calculated as the arithmetic average of prices so for example SMA period 10 would be the average of 10 prices:
($1+$2+$3+$4+$5+$6+$7+$8+$9+$10)/10 = 5.5
The EMA is calculated similarly, however it looks more at the most recent data and is therefore more relevant when doing shorter trades rather than long term investments. With EMA the results are more timely that’s why it is so popular amongst many traders. As EMA reacts more quickly to the price changes than the SMA. It can analyse the trend quite accurately.
How do you use it?
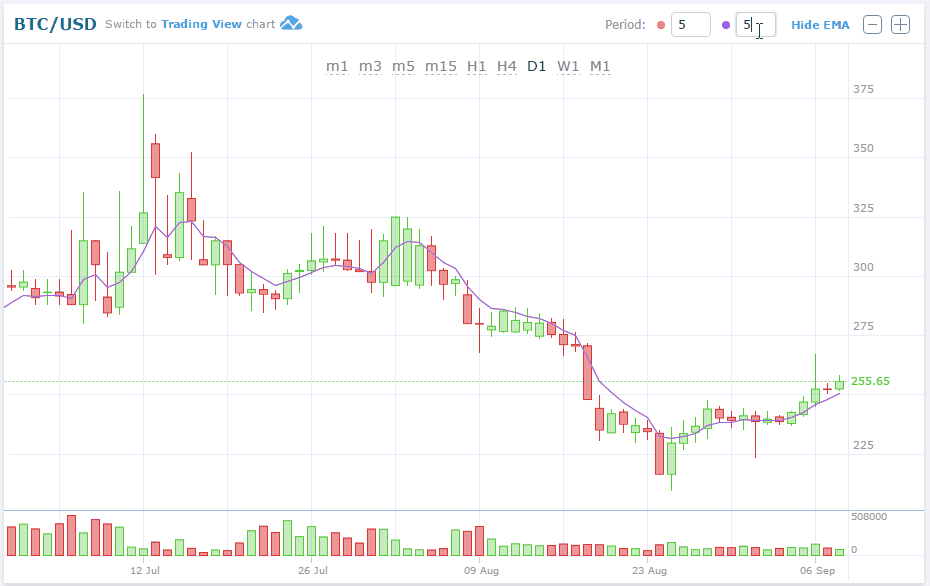
The most common and probably the best way to use EMA-s is to have a shorter and a longer period EMA-s together. The most frequently used periods are 5, 10, 12, 20, 26, 50, 100, and 200. So which to choose from ? Generally the shorter term your trades, the shorter periods you should be looking at. One of the most common combinations is periods of 50 and 10 or 20.
If trading for a trend reversal this is what to watch – you should be looking for a crossover of the two EMA-s. The price is expected to go up when the shorter term EMA crosses the longer EMA, this is when you enter a Buy position. When the longer EMA crosses the short one the price is expected to reverse and continue down – that’s when you enter a Sell position..
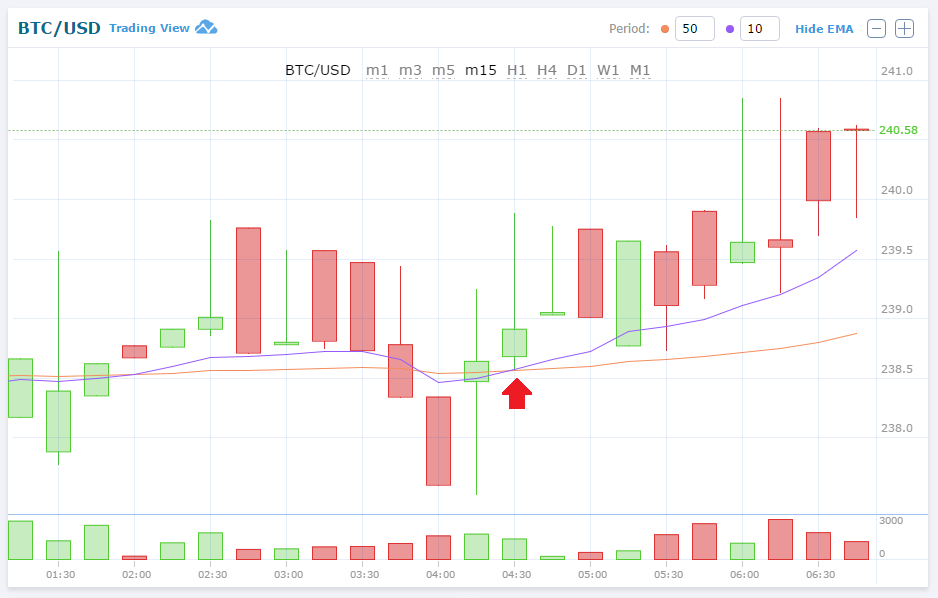
Trend reversal, enter a Buy position
Another way is trend trading – as long as the price stays below the EMA-s the traders will continue going with Buy trades, when the price is below you follow the trend going down and execute Sell trades.
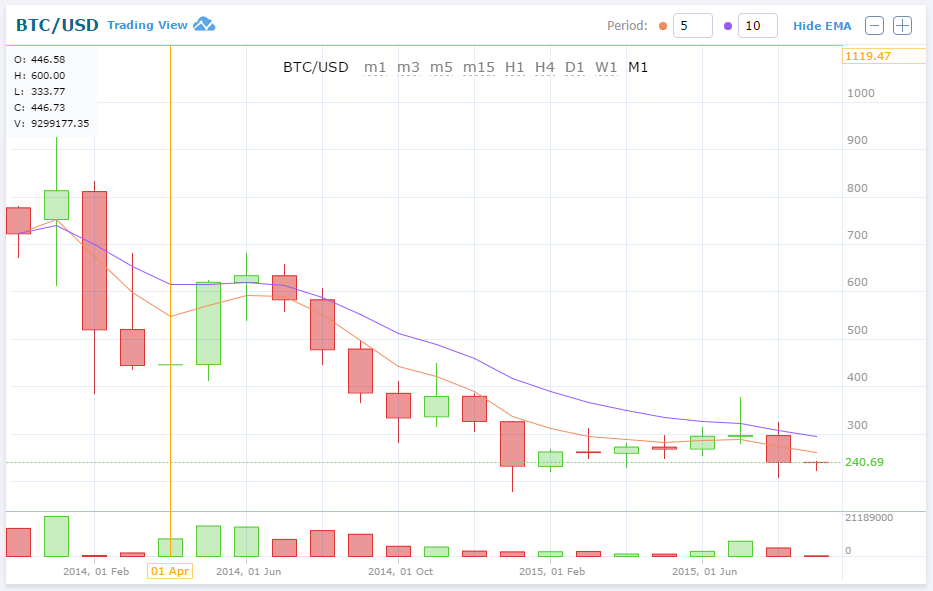
When the price is under the EMA-s, follow the downtrend with Sell positions
Seems simple enough ?
Regrettably there’s no such thing as a 100% profit strategy, however when using great tools like EMA-s and doing your own market analysis you’re definitely on the right track. I suggest practicing on a demo account first to make sure you have the correct settings for your indicators and you are comfortable with the strategy. You also need to practice to start getting the timings right – the more you trade the better feel of it you will get and you will be on your way to make better decisions and grow your profits even higher. You can play around and gain experience on our free demo account here.
In addition to that I always suggest you keep up with the current economic news – both about fiat and cryptocurrencies. As crypto’s are very volatile they respond very heavily to news. By keeping up to date with the ongoings of the markets you will have a wider knowledge of how and why these currencies fluctuate in price and in time you will truly become an expert at it.
Come and start your trading success on our platform.
Happy Trading!