Bitcoin in April - Price Analysis

We’re gonna start giving you a monthly overview of the Bitcoin price. Technical analysis is the key to success and trading profitably. This is why we’re going to do a monthly look back on its movements and giving you info on the indicators and support and resistance levels. This will help you have insight into what the price might be up to in the near future, helping you execute more profitable trades.
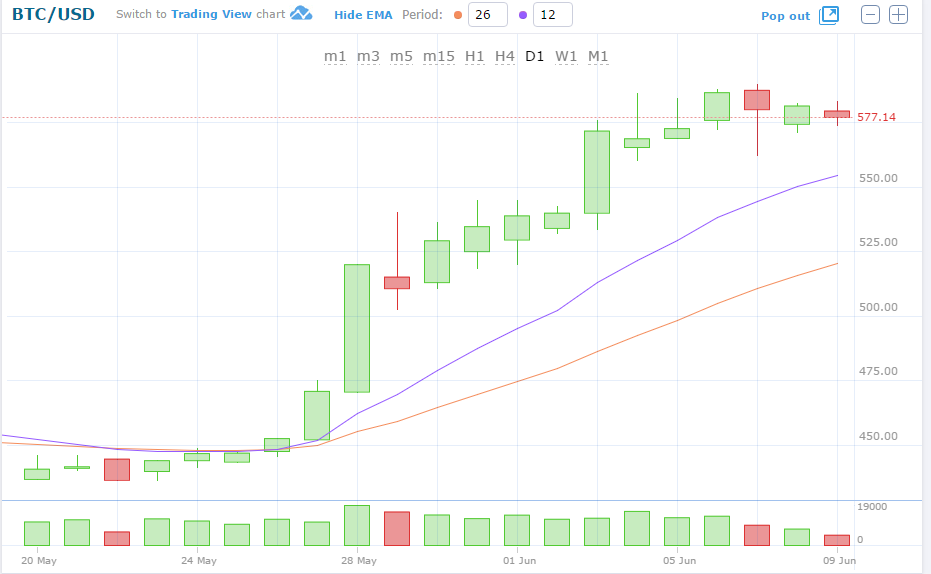
Bitcoin Price in April – Technical Analysis
The price hit a recent high at the end of April hitting highs of $470. This resistance level was previously tested at the end of December 2015 and again in January 2016. As this level still remains unbroken, we’re expecting the price to do a pullback in the next few months. As Bitcoin gains strength again testing the new highs again, I predict there to be a few months with the bears. You can read more about trading support & resistance levels in our previous post on ready to use strategies.
The next distinctive support level is around $430 – an excellent tested level. If the price regains strength at this level, there would be possibilities for the bulls to return and break the level of $470. I would expect a long term uptrend if these conditions occur. We just need to wait and see. As the news impacting Bitcoin’s price have been rather slow recently, that is another indication of the price continuing a steady climb after a little pullback.
If falling through the support level at $430 the next support will be at around $370 giving even a better opportunity to buy.
Simple Moving Average
The 100 Simple Moving Average is above the 200 Simple Moving Average, also letting us know that the price is on a strong uptrend. Although the resistance has been hit at $470 the indicators are still suggesting a continuing uptrend after a minor pullback. On top of this the gap between the 200 SMA and 100 SMA is getting wider, which is also suggesting a longer race for the bulls. This suggests possibility of breaking the resistance level of $470 after a pullback and heading towards the next level of $500.
Looking at data and different indicators is the key to success in trading. Knowing the tested levels and signals indicating overbought and oversold signals will help you make better decisions. You can also set up indicators on our platform to help you along in your trading. Here’s more about Exponential Moving Averages, which is available on our web trading platform.
Start taking advantage of the markets here!
Disclaimer
Even though I try to give you the best advice possible, please understand that the markets can be unpredictable and trading is risky. It might result in the loss of some or all your investment. Never trade with capital you can’t afford to lose.